VOLCANOES
Volcanoes did not play an important role in the Scriptures. However, some scholars have theorized that some of the events documented in the Scriptures were due to the actions of volcanoes, usually catastrophic events, possibly the plagues in Egypt. They played a factor in forming the terrain since the Biblical territory of Bashan, the now famous Golan Heights, was formed by extinct volcanoes. But for our purposes we are interested in volcanoes for what they can possibly tell us about the age of the earth.
Hawaii, beautiful vacation land, land of peace and harmony, yet each island was born of tremendous heat and violence. The long chain actually starts with Loihi seamount which is presently not visible since it is still approximately three thousand feet below sea level. It sprang to life again in 1996 and during the summer of 1996 the largest swarm of earthquakes ever recorded on ANY Hawaiian volcano shook Loihi seamount. The swarm began on 17 July 1996; to date, a total of over 5000 earthquakes have been recorded by the Hawaii Volcano Observatory (HVO) network. Does this mean that soon we will be seeing video clips on the TV news of a new island being born? Probably not, since many volcanologists propose that it will be thousands of years before Loihi becomes an island. Seabeam bathymetry images taken in 1997 show that where there had once been a 300 meter tall cone called Pele's Vents there was a new pit approximately 200 meters deep that has been named Pele's Pit.
Next in the chain is Kilauea volcano, on the south side of the Island of Hawaii. It is one of the most active on Earth. Its current eruption (known as the Pu`u `O`o Eruption) started in January 1983 and as of January 2000 had produced 1.9 km3 of lava (0.112 km3/yr), had covered 102 km2, and had added 205 hectares to Kilauea's southern shore. In the process, lava flows unfortunately destroyed 181 houses and resurfaced 13 km of highway with as much as 25 m of lava. It has also destroyed a National Park visitor center and a 700 year-old Hawaiian temple ("Waha'ula heiau" before and after). There are no signs that the current eruption is slowing or will come to an end anytime soon.
(from http://www.soest.hawaii.edu/GG/HCV/loihi.html)Kilauea shares the Hawaiian hot spot with its larger active sibling Mauna Loa and with Loihi seamount. Mauna Loa, or "Long Mountain" in Hawaiian, it rises 13,680 ft. (4,170 m) above sea level. USGS estimates are that due to the 33 recorded eruptions from January 10, 1843 to March 26,1984 on Mauna Loa it has added 4.124 km3 to the Hawaii landscape, a rate of only 0.029 km3 per year. However, Mauna Loa is a REALLY tall and big mountain. At 60 miles long and 30 miles wide, it makes up half of the entire island. When one considers that the flanks of Mauna Loa sit on sea floor that is about 16,400 ft (5,000 m) deep, the "height" of this volcano relative to neighboring land (the sea floor) is more like 30,080 ft (9,170 m)! Mauna Loa is the largest active volcano in the world. In fact, using this last measure of it's height, it is one of the tallest mountain in the world (although many mountains, such as Mt. Everest in the Himalaya mountain range, sit higher relative to sea level). Mauna Loa is a "shield volcano", which means it is a gently sloping mountain produced from a large number of generally very fluid lava flows.
Mauna Kea is the tallest mountain in the Hawaiian Chain. Its summit rises to an elevation of 4205m above sea level. It is the second largest in subaerial surface area of the five shield volcanoes that comprise the island of Hawaii, but is considered to be extinct. Also on the big island is Haulalai. The summit of Hualalai rises to an elevation of 2523m (8271ft) above sea level. The most recent eruption of 1800-1801 occurred along a northwest rift zone.
Other than the locations on Hawaii, the last volcano to be active was just to the west on Maui, Haleakala. It was last active in 1790, but could become active again at any time as world wide volcano history testifies. (for more on the Hawaiian volcanoes visit http://www.soest.hawaii.edu/GG/hcv.html)
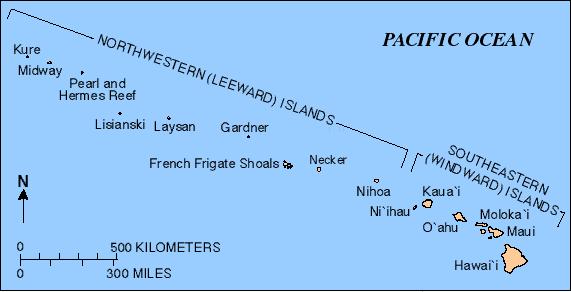
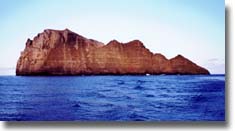
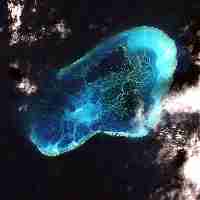
However, the occupied islands of Hawaii that so many are familiar with is only a small part of the story as shown in the above figures. There is a long string of islands, coral atolls, and seamounts in a long chain that complete the picture. Each formed by volcanic action and modified over a long time by the forces of our wonderful planet. As one moves along the chain erosion and subsidence has taken its toll and the amount of exposed land area decreases dramatically, a testimony to the age progression along the chain. The extent of the coral deposits are relatively small around the occupied islands and progress until at Midway, where core drillings have been taken, there is a minimum of 820 feet (250 m) thick deposits and with limestone showing up to depths of around 1066 feet (325 m). The following figures show Nihoa island, Pearl & Hermes reef, and an animated depiction of the life of a volcanic Pacific island.
The question is how could such an extensive chain of volcanoes be formed in a relatively short time? The most recent island building work of Kilauea of 1.9 km3 in 17 years is very inadequate. Kilauea is at a minimum 25,000 km3 or 6,000 miles3 in volume per the USGS. At the present rate it would take approximately 220,000 years to build the present volcano. However, evidence on the volcano indicate that it has not always produced flows at the present slow and relatively steady rate. Large and thick deposits of ash and pumice are present from older eruptions, reported in 1790 and again in 1924. Along the cliffs of the Hilina fault system are exposed 9 ash layers indicative of such eruptions, estimated to be thousands of years old (ref. http://geopubs.wr.usgs.gov/fact-sheet/fs132-98/).
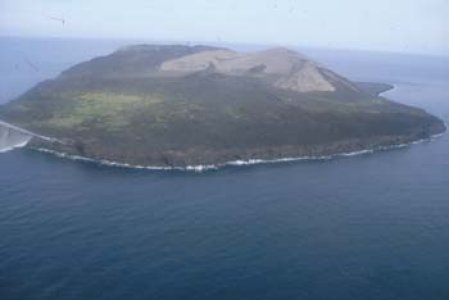
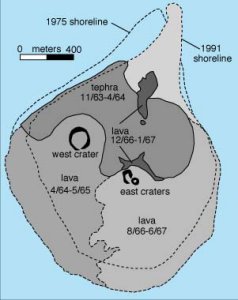
Surtsey, Iceland from Nov. 8, 1963 to June 5, 1967 put forth an estimated 1 km3 to form the present volcano from a sea floor at 130 meters depth (ref. http://volcano.und.nodak.edu/vwdocs/volc_images/europe_west_asia/surtsey.html). Shown below are a photo and a map of Surtsey, note that some green growth has appeared, but only to a limited extent, and the erosion effects on the map. Some have predicted that unless there are more island building eruptions, Surtsey will no longer be seen above sea level in 100 years.
Should Kilauea have grown continuously at the 1 km3 per 3.5 year rate it could have been built in 87,500 years.
Reportedly the greatest eruption of last century was in Katmai Alaska in 1912 (ref. http://wwwhvo.wr.usgs.gov/kilauea/) when an estimated ten cubic kilometers of pumice and ash was expelled. In recorded history possibly the Katmai eruption was surpassed only by Karakatau in 1883, Tambora in 1815, and Greece's Santorini eruption in ~1600 BC.(see Appendix A) The June 1912 eruption of Novarupta Volcano changed the Katmai dramatically. After the eruption 65 square kilometers (40 sq. miles) of lust green wilderness lay buried beneath hot pumice and ash, as much as 200 meters (700 ft.) deep in some areas. In near by Kodiak, for two days a person could not see a lantern held at arm's length. We don't know how much of the eruption was new material and how much was just relocation of material from the cone! (ref. http://volcano.und.edu/vwdocs/Parks/katmai/katmai.html).
If Kilauea could perform in this manner , output 10 km3 per year , it could possibly be built in 2500 years. However, there is definitely no evidence that such an occurrence could happened every year. See appendix D for indications in tree rings that the Hawaiian activity for the last 4000+ years has been relatively minor in nature.
And also don't forget, we need to build numerous volcanoes along the approximately 3045 mile long chain. The sister and elder volcano Mauna Loa, is much larger with a volume of 19,000 miles3 or 80,000 km3, more than three times the size of Kilauea. Many scientists believe that earlier in the Earth's history there were higher levels of volcanic activity, but the building of such an extensive chain of seamounts and islands in less than 10,000 years is difficult to visualize. Visualize, if you can, the crustal plate moving over the volcanic hot spot at a rate of 0.76 mile in a year, 8,025 times present max. rates, and volcanic material pouring forth at a rate greater than 188 cubic kilometers a year, 1,677 times present rate, assuming we need to build the equivalent of approximately 30 or more Kilauea's ( > 750,000 km3 ), in less than 4,000 years! Or even on a much smaller scale, building only Mauna Loa in less than 4,000 years would require average flow rates of 178.9 times the 17 year output rate of Kilauea!
We also need the appropriate amount of erosion, subsidence, and coral deposit development in such a relatively short time. The latest studies seem to indicate that the maximum rate of coral reef development is 21 meters per thousand years at optimum conditions. However, these studies indicate that coral reef development is not a continuous process. That sea temperatures, sea levels, water clearness, storms, pests and diseases are among the many factors that cause coral reef development to be an on again, off again process with mean reef growth values being between 1.3 and 4.2 meters per thousand years. (ref. http://cima.uprm.edu/~morelock/abstract/glynn30.htm ) For most coral to grow water must be relatively warm and shallow since energy from the sun is used in photosynthesis. Deep water blocks all sunlight and only very specialized corals can survive. Also should the coral start to develop while the volcano is still in the building stage, the newly developed coral formations may possibly be covered by new lava flows or ash and pumice. The 1993 "Hawaii Scientific Drilling Project" which drilled into Mauna Loa/Mauna Kea near the seashore hit a 85 feet (~26 m) thick deposit of "calcareous sediment" (coral reef deposit) after drilling through 100 feet of basalt. Possibly indicating 1,238 years of growth at the most optimum growth rate or around 20,000 years of growth at the slower 1.3 m/kyr growth rate. The above given reef growth rates also possibly indicate that if conditions were extremely optimum it would take at a minimum 11,905 years to build the coral reef deposit thickness at Midway. At the more reasonable 4.2 m/kyr development rate it would take 59,523 years to develop the 250 m thickness and this would start some time after the island building phase had slowed down and wave erosion had starting building the shallow shelves around the island necessary for extensive coral development.
Conclusion: The known physical characteristics of the volcanic Hawaiian Archipelago along with calculations based on known historic volcano performances presents a strong case against the formation of such an extensive chain in less than 10,000 years. Such a rapid formation would require crustal plate movement and volcanic material flows far exceeding known values for each parameter. Coral reef development speed would also seem to be a major problem. These indicators are proposed as strong evidence against a young earth, and strongly favoring an old age earth.


Appendix A: USGS ratings of some historic eruptions.
(from http://pubs.usgs.gov/publications/msh/comparisons.htm)
The ~1600 BC Santorini eruption has been estimated at 30-33 km3, after which the caldera collapsed into the sea. Submarine lava flows continued after the caldera collapse and were reported to emerge above sea level in 197 BC. Since then 11 recorded flow events have formed the Kameni Islands in the center of the caldera, with the last being in 1950. Though rising to 500 meters above the floor, only an estimated 2 km3 of the collapsed caldera has been refilled in about 3600 years. The Mount Mazama (now called Crater Lake, Oregon) eruption which the USGS has estimated at 42 km3 in ~5000 BC has also refilled to only a very limited extent. But even the larger of the above eruptions pales by comparison with the gigantic pyroclastic eruption evidences from volcanic systems such as Long Valley Caldera (California), Valles Caldera (New Mexico), and Yellowstone Caldera (Wyoming).
However, what would seem to be required to best build a long chain of volcanoes from the sea floor that extends for thousands of miles in length are not sudden violent eruptions. Especially if the sudden expulsion is followed by a collapse and it requires an extended time period for recovery as illustrated by Santorini and Mazama. The Hawaiian volcanoes, as are most volcanoes, are layered with ash interbedded within lava flows. The scientists of the 1993 "Hawaii Scientific Drilling Project" identified a minimum of 262 layers when drilling to 2460 feet(1056 m) into Mauna Loa/Mauna Kea. Around 80 percent of the layers were various forms of basalt, and the remaining layers interspersed within the basalt were characterized as coral(8), ash(15), soil(14), ash and soil mixed(10), and basaltic sand(5). (ref. http://expet.gps.caltech.edu/Hawaii_project.html) The below USGS "Simplified map of the Island of Hawai`i, showing the average rates of lava extrusion for historical eruptions on Mauna Loa (brown). The volcano is divided into four major sectors downslope from Moku`aweoweo caldera (shown in red): NER = northeast rift zone; MKS = Moku`aweoweo south; SWR = southwest rift zone; MKN = Moku`aweoweo north. In parenthesis, the rates of extrusion within each sector are in millions of cubic meters per day (6 = 6,000,000 m3/day). For comparison, the average rate of lava extrusion at Kilauea Volcano during the Pu`u `O`o eruption is less than 0.5 million cubic meters per day." (from http://wwwhvo.wr.usgs.gov/maunaloa/hazards/rate.html)

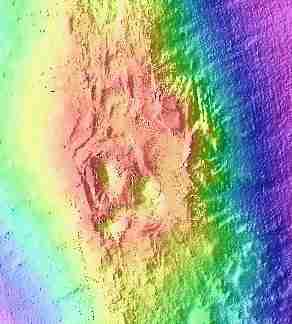
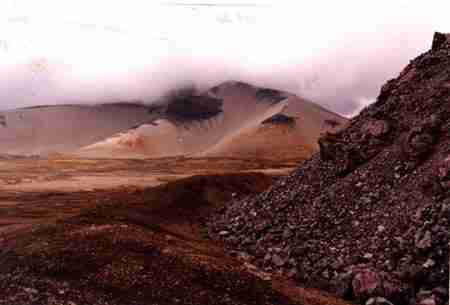
The known history of Santorini, Vesuvius and most others, indicates there is most often extended time periods of inactivity between layer building activity. Such extended periods of inactivity would greatly decrease the average yearly building rate for each volcanic island/atoll/seamount. The continuously active volcano is rare, such as Stromboli, which has been almost continuously active for a minimum of 2000 years, and some say 5000 years. But at Stromboli the large volume eruption or lava flow is very rare and therefore it has done relatively little building in recorded history. The USGS studies of lava flows on Haleakala is an illustration of the intermittent nature of volcanic activity, especially in the postshield stage, as shown below.
(from http://hvo.wr.usgs.gov/volcanoes/haleakala/cratermap_large.jpg)
Volcanos like Kilauea or Mauna Loa grow faster and erupt more frequently during the preshield and shield-building stages, when they are closer to the center of the hot spot. Possibly the recent history lava flow champ was at Laki, Iceland in 1783-1784 when 14.7 km3 was produced in 8 months. And near the same area, the Eldgja flow in ~935 put out 19.6 km3 in 3 to 8 years (the time is uncertain due to poor records). These flows in Iceland make a very good showing in the Greenland icecores due to their closeness to the drilling location. Recent studies have possibly identified evidences of much greater flow rates at the Columbia lava plateau, possibly 1300 km3 in 5 to 15 years, but these estimates are difficult to verify. The Columbia lava plateau consists of approximately 175,000 km3 of material from over 300 major flows and countless smaller flows. And even if the evidences for very high lava flow rates in the Columbia area are verified, the evidences are that there were also extended periods of inactivity. Therefore, the entire 175,000 km3 lava flow area was not developed in a short time period, but instead over a very extended time period. Scattered over the world there are many large igneous flow areas which give solid evidence of extreme activity in the past, some estimated at 10 times the size of the Columbia area, such as the Deccan Traps area of India.
Appendix B: Hawaiian Legends of volcanic center movement
The Pele myths were associated with the genealogies of royal chiefs, with some genealogies extending back in time an astounding 95 generations. Some scholars believe that the occupants of the islands first arrived some time between 400 to 600 AD. And nearly all who study the history of the Hawaiians believe that they have occupied the islands for at least a minimum of 1000 years. Therefore the maximum possible time to be allowable for the forming of the west most occupied islands on which they would have first settled could be shortened by as much as 1600 years.
Appendix C: Pacific Atoll Drilling Results including Midway
Appendix D: TREE RINGS AND VOLCANOES
"Since the eruption of Mt. St. Helens and El Chichon in Mexico in 1982, there has been a renewed interest among scientists on a possible connection between large volcanic eruptions and significant effects on the climate. Some volcanoes inject sufficient material into the stratosphere that the amount of radiation received at the surface of the Earth from the Sun is materially altered. Large volcanic explosions deposit fine silicate ash and sulphur aerosols in the stratosphere, and these may remain there for some time.
Models of this type of event suggest that there would be an expansion of the region of circulating arctic air over western North America in January and a July weather pattern that would resemble those of a normal mid-May. One result of such weather would be to produce frosts in the height of the growing season in western North America.
Frost damage to mature trees is rare but can occur during the growing season with two successive nights at -5 C and days not above freezing. The freezing of water outside the immature growing cells crushes them and leaves a permanent record of frost in the tree ring for that year. In fact, the type of damage observed in the ring is different for the early part of the growing season and the late part. In a given tree ring, the date of the frost can sometimes be determined to within a week or two.
In several locations of the western United States lives the oldest known living thing on Earth: this is the Bristlecone pine (Pinus longaeva). In one location at Campito Mountain in the White Mountains of California, living trees and deadwood pieces provide an accurate year-by-year tree ring sequence back to 3435 BC, a continuous record for five and one-half thousand years! (Update: The bristlecone pine chronology in the White Mountains currently extends back almost 9,000 years continuously. That's to 7,000 BC! Several pieces of wood have been collected that will extend this date back even further. The hope is to push the date back to at least 8,000 BC. This will be important as the last Ice Age ended about 10,000 years ago, and to have a record of this transition period would offer scientists a wealth of information. (from http://www.sonic.net/bristlecone/dendro.html))
V. C. LaMarche and Katherine Hirsckboeck have recently reported, in the magazine Nature, on a study of the frost damage in the rings of the Bristlecone pine. In the recent tree-ring records, they find a remarkable correlation between frost damage rings and the known date of large eruptions. For example, in the past 100 years, there have been four climactically important events: Krakatoa (1883), Pelee, Soufriere (1902), Katami (1912), and Agung (1963). In each case, a ring of frost damage was found and always in the same year if the eruption was early in the year or, otherwise, the next year. The frost ring never preceded the volcanic event, which seems to prove that the frost rings are the result of the eruption.
When the tree ring record is examined back in time, there are some interesting results. Seventeen events are found in the rings between 2035 BC and 1884 AD. Some of these are known from other paleontological or historical evidence. For example, Mt. St. Helens erupted in 1500 AD and 2035 BC and Mt. Etna in 42 BC.
Of particular interest is the explosion of Santorini or Thera in the Agean Sea. This great explosion has been suggested as the cause of the decline of the Cretan civilization about 1450 BC. However, radio carbon dating of material found on Thera has given 1688 BC within an uncertainty of 50 years. (Update: reported on Athens News Agency, 12/03/2008, new precision radiocarbon dating of two recovered olive brances puts the catastrophe at 1613 BC, with an error margin of plus or minus 10 years (1603 to 1623)) Now the tree ring frost tells us that Santorini exploded in 1626 BC or, at most, one or two years earlier; i.e., about 275 years before the sudden decline of Crete, which thus still remains a mystery."
(from http://www.physics.uoguelph.ca/summer/scor/articles/scor23.htm)
The above indication that for 3919 years starting in 2035 BC there were only 17 significant world climate altering volcanic eruptions, many of which can be identified to a known historic eruption, is another way of saying in essence that during this time any above sea level activity in the Hawaiian Archipelago was by comparison of a relatively minor magnitude. And the Greenland icecores also tend to verify this conclusion. In other words, it is proposed that if over the last 4000 years there had been considerable above sea level activity in Hawaii of much greater magnitude than Laki or Eldgja, possibly up to 10 times or more, then there should have been many such indications in the records of the tree rings and/or strong showings in the Greenland icecore data.


 The Earth's rocky outer crust solidified billions of years ago, soon after the Earth formed. This crust is not a solid shell; it is broken up into huge, thick plates that drift atop the soft, underlying mantle.

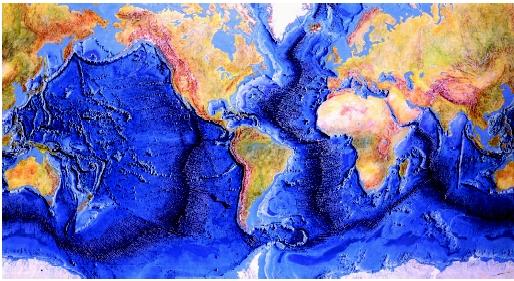
 Seafloor spreading is the movement of two oceanic plates away from each other (at a divergent plate boundary), which results in the formation of new oceanic crust (from magma that comes from within the Earth's mantle) along a a mid-ocean ridge. Where the oceanic plates are moving away from each other is called a zone of divergence. Ocean floor spreading was first suggested by Harry Hess and Robert Dietz in the 1960's.
 When two plates collide (at a convergent plate boundary), some crust is destroyed in the impact and the plates become smaller. The results differ, depending upon what types of plates are involved.
 When two plates move sideways against each other (at a transform plate boundary), there is a tremendous amount of friction which makes the movement jerky. The plates slip, then stick as the friction and pressure build up to incredible levels. When the pressure is released suddenly, and the plates suddenly jerk apart, this is an earthquake.
  In 1915, the German geologist and meteorologist
  Wegener hypothesized that there was an original, gigantic supercontinent 200 million years ago, which he named Pangaea, meaning "All-earth". Pangaea was a supercontinent consisting of all of Earth's land masses. It existed from the Permian through
  Pangaea started to break up into two smaller supercontinents, called Laurasia and Gondwanaland, during the Jurassic period. By the end of the Cretaceous period, the continents were separating into land masses that look like our modern-day continents.


